Choosing the backend
echelle provides support for two different backends when dealing with interactivity. The default backend is bokeh, due to its good performance. The fall-back is to use the matplotlib widgets. The only time I recommend choosing matplotlib is a backend is when you are working outside of a Jupyter notebook environment (i.e., accessing echelle from the terminal).
Let’s use the same star from our previous example:
[1]:
import lightkurve as lk
lc = lk.search_lightcurve('KIC 11615890').download_all().stitch()
pg = lc.to_periodogram(normalization='psd')
freq, amp = pg.frequency.value, pg.power.value
Bokeh
Bokeh is the default backend for echelle. When using Bokeh, you will need to pass in the URL of the notebook if there are multiple notebooks open. echelle will warn you about this.
[2]:
import echelle
[3]:
echelle.interact_echelle(freq, amp, 5, 10)
/Users/daniel/Dropbox (Sydney Uni)/code/echelle/echelle/interact.py:192: UserWarning: You have multiple Jupyter servers open.             You will need to pass the current notebook to `notebook_url`.             i.e. interact_echelle(x,y,notebook_url='http://localhost:8888')
  UserWarning,
ERROR:bokeh.server.views.ws:Refusing websocket connection from Origin 'http://localhost:8080';                       use --allow-websocket-origin=localhost:8080 or set BOKEH_ALLOW_WS_ORIGIN=localhost:8080 to permit this; currently we allow origins {'localhost:8888'}
WARNING:tornado.access:403 GET /ws (::1) 3.05ms
Matplotlib
Matplotlib has no such constraints and can work from the terminal or in a Jupyter notebook.
If you use matplotlib from a notebook you must set the following cell magic:
[1]:
%matplotlib notebook
If you want the cells to “pop out” from the notebook and appear as a separate window, you need to instead call:
[ ]:
%matplotlib qt
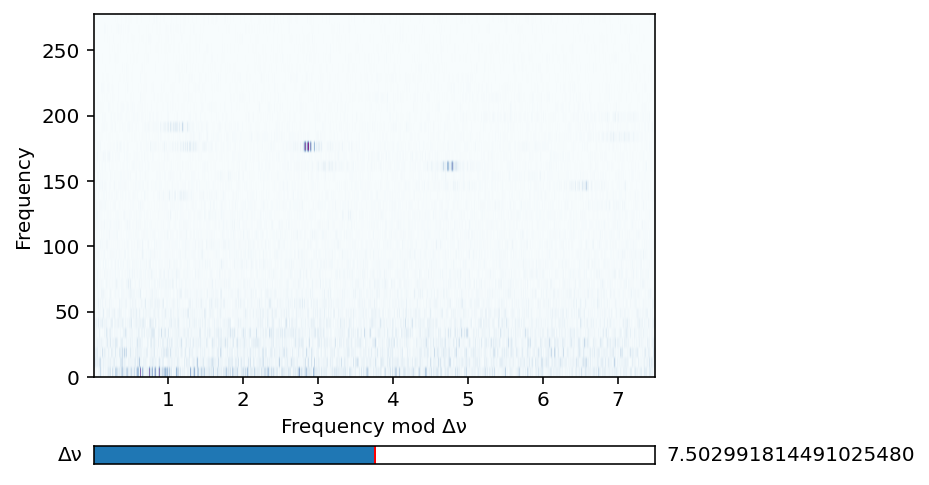
[4]:
echelle.interact_echelle(freq, amp, 5, 10, backend='matplotlib')